
SHAP (SHapley Additive exPlanations) is a game theoretic approach to explain the output of machine learning models.
It assigns each feature an importance value for a particular prediction, providing a more detailed understanding of the model’s behavior compared to global feature importance measures.
In this example, we’ll demonstrate how to calculate and plot SHAP values for an XGBoost model using the SHAP library.
We’ll use a synthetic dataset generated by scikit-learn’s make_classification function to keep the example concise and easy to understand.
First, install the required SHAP library using pip:
pip install shap
Now, let’s create the example:
from sklearn.datasets import make_classification
from sklearn.model_selection import train_test_split
from xgboost import XGBClassifier
import shap

# Generate a synthetic dataset
X, y = make_classification(n_samples=1000, n_features=10, n_informative=5, n_redundant=2, random_state=42)

# Split the data into train and test sets
X_train, X_test, y_train, y_test = train_test_split(X, y, test_size=0.2, random_state=42)

# Create an XGBClassifier
model = XGBClassifier(
    objective='binary:logistic',
    max_depth=3,
    learning_rate=0.1,
    subsample=0.8,
    colsample_bytree=0.8,
    early_stopping_rounds=10,
    n_estimators=100,
    random_state=42
)

# Train the XGBoost model
model.fit(X_train, y_train, eval_set=[(X_test, y_test)], verbose=False)

# Calculate SHAP values
explainer = shap.TreeExplainer(model)
shap_values = explainer.shap_values(X_test)

# Plot SHAP values
shap.summary_plot(shap_values, X_test, plot_type="bar", feature_names=[f"feature_{i}" for i in range(X_test.shape[1])])
The plot may look like the following:
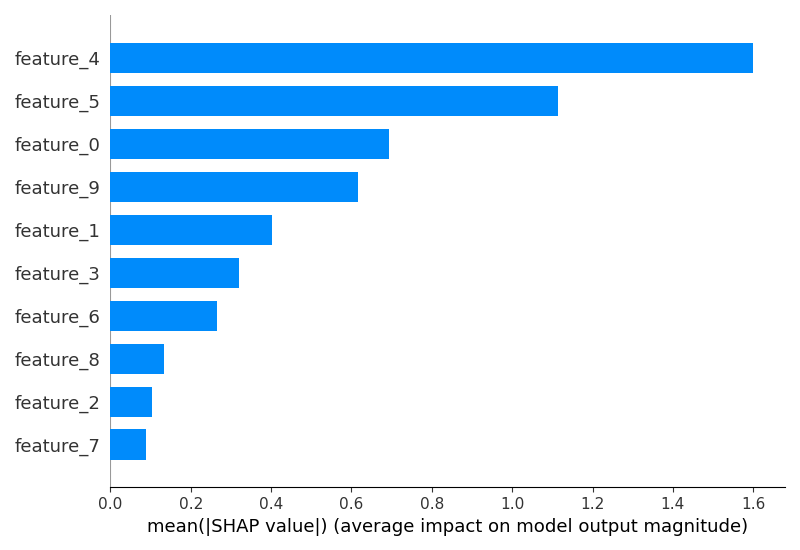
SHAP values represent the impact of each feature on the model’s prediction for a given sample. A positive SHAP value indicates that the feature increases the model’s output, while a negative value indicates that the feature decreases the output. The magnitude of the SHAP value represents the strength of the feature’s influence.
In this example, we first generate a synthetic dataset and split it into train and test sets. We then create an XGBClassifier, set its parameters, and train it on the training data.
Next, we use the SHAP library to calculate SHAP values for the XGBoost model. We create a TreeExplainer object, which is designed to work with tree-based models like XGBoost, and pass our trained model to it. We then calculate the SHAP values for the test set using the shap_values() method.
Finally, we plot the SHAP values using the summary_plot() function. We specify plot_type="bar" to create a bar plot that shows the mean absolute SHAP values for each feature, indicating their overall importance. We also provide custom feature names for better interpretability.
By analyzing the SHAP values, you can gain a more granular understanding of how each feature contributes to the model’s predictions, complementing the insights provided by global feature importance measures like permutation importance.