
XGBoost is known for its ability to leverage multiple CPU cores to speed up training, but you may have noticed that it doesn’t always fully utilize all available cores, even when configured to do so.
In this example, we’ll investigate the relationship between the number of threads (n_jobs), the number of estimators (n_estimators), and CPU utilization using the psutil library.
We’ll visualize the results to better understand how these factors interact and affect training time.
Firstly, we must install the psutil library using our preferred Python package manager, such as pip:
pip install psutil
Next, we can confirm that XGBoost does not maximize CPU usage while training, given different numbers of threads and boosting rounds:
import psutil
import pandas as pd
from sklearn.datasets import make_classification
from xgboost import XGBClassifier
import matplotlib.pyplot as plt

# Generate a synthetic dataset for binary classification
X, y = make_classification(n_samples=1000000, n_features=20, n_informative=10, n_redundant=5, random_state=42)

# Define the range of threads and estimators to test
threads_range = range(1, 5)
estimators_range = [10, 50, 100, 200, 300, 400, 500]

# Initialize a DataFrame to store the results
results_df = pd.DataFrame(columns=['threads', 'estimators', 'cpu_utilization'])

# Iterate over the number of threads and estimators
for threads in threads_range:
   for estimators in estimators_range:
       # Initialize an XGBClassifier with the specified parameters
       model = XGBClassifier(n_jobs=threads, n_estimators=estimators, random_state=42)

       # Measure CPU utilization before training
       _ = psutil.cpu_percent()

       # Train the model
       model.fit(X, y)

       # Measure CPU utilization since last call
       cpu_percent_during = psutil.cpu_percent()

       result = pd.DataFrame([{
                           'threads': threads,
                           'estimators': estimators,
                           'cpu_utilization': cpu_percent_during
                       }])
       # Report progress
       print(result)

       # Append the results to the DataFrame
       results_df = pd.concat([results_df, result], ignore_index=True)

# Pivot the DataFrame to create a matrix suitable for plotting
plot_df_cpu = results_df.pivot(index='estimators', columns='threads', values='cpu_utilization')

# Create a line plot
plt.figure(figsize=(10, 6))
for threads in threads_range:
   plt.plot(plot_df_cpu.index, plot_df_cpu[threads], marker='o', label=f'{threads} threads')

plt.xlabel('Number of Estimators')
plt.ylabel('CPU Utilization (%)')
plt.title('XGBoost CPU Utilization vs. Number of Estimators and Threads')
plt.legend(title='Threads')
plt.grid(True)
plt.xticks(estimators_range)
plt.show()
The plot may look as follows:
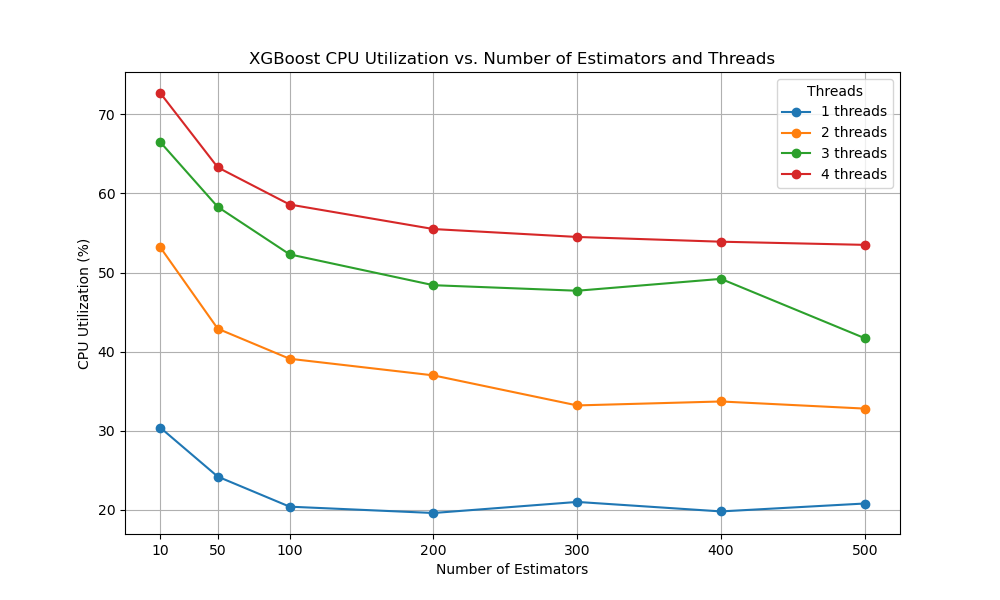
The plot shows how CPU utilization increases with the number of threads and decreases with the number of boosting rounds.
We can observe that CPU utilization does not reach 100%, in fact, CPU usage rarely rises above 50% or 60%.
This example demonstrates how to investigate XGBoost’s CPU utilization while varying the number of threads and estimators. By visualizing the results, you can gain insights into how these parameters interact and make informed decisions when tuning your XGBoost models for optimal performance.