
Out-of-bag (OOB) estimates provide a convenient way to assess the performance of a bagged model without the need for a separate validation set.
By plotting OOB estimates during training, you can monitor the model’s performance and detect overfitting.
XGBoost does not natively support Out-of-bag (OOB) estimates, but we can simulate the effect by evaluating the model on the training dataset or a separate validation dataset.
Here’s how you can simulate a plot OOB estimates for an XGBoost classifier:
import numpy as np
from sklearn.datasets import make_classification
from xgboost import XGBClassifier
import matplotlib.pyplot as plt

# Generate synthetic binary classification dataset
X, y = make_classification(n_samples=1000, n_classes=2, random_state=42)

# Train an XGBoost classifier with OOB estimates
xgb_clf = XGBClassifier(n_estimators=100, subsample=0.8, eval_metric='logloss')
xgb_clf.fit(X, y, eval_set=[(X, y)], verbose=False)

# Retrieve OOB estimates from the model
oob_error = xgb_clf.evals_result()['validation_0']['logloss']

# Plot OOB estimates
plt.figure(figsize=(8, 6))
plt.plot(np.arange(len(oob_error)), oob_error, label='OOB Estimate')
plt.title('OOB Loss Estimate')
plt.xlabel('Boosting Iterations')
plt.ylabel('OOB Loss')
plt.grid()
plt.legend()
plt.show()
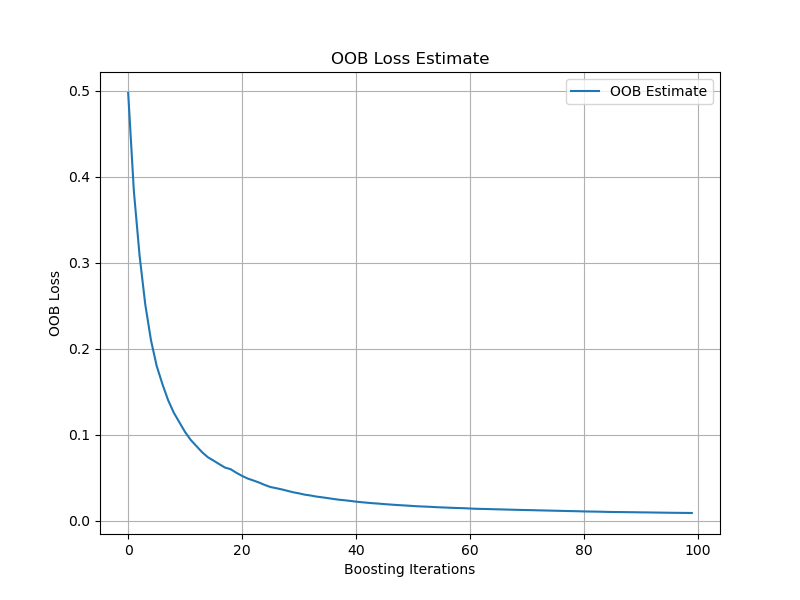
The generated plot may look like the following:
Here’s a step-by-step breakdown:
First, we generate a synthetic binary classification dataset using scikit-learn’s
make_classificationfunction. This is just for illustration purposes; in practice, you would use your actual training data.We define our XGBoost classifier (
XGBClassifier) with OOB estimates enabled. We setsubsample=0.8to perform bagging, which is necessary for OOB estimates.We train the model using the
fitmethod and specify an evaluation dataset viaeval_set.After training, we retrieve the OOB loss estimates from the
evals_result()method of the trained model. The OOB estimates are stored under the key'validation_0'.Finally, we plot the OOB loss estimates against the boosting iterations.
By analyzing the OOB error plot, you can gain insights into the model’s performance and detect potential overfitting. If the OOB error starts to increase after a certain number of iterations, it suggests that the model is starting to overfit to the training data.
You can use this information to make decisions about model tuning. For example, you might consider:
- Reducing the number of boosting iterations (
n_estimators) to prevent overfitting. - Adjusting the learning rate (
learning_rate) to control the contribution of each tree. - Modifying the maximum depth of the trees (
max_depth) or the minimum number of samples required to split a node (min_child_weight) to control the complexity of the model.
By monitoring the OOB estimates and making appropriate adjustments, you can find the sweet spot where the model achieves good performance without overfitting.
OOB estimates provide a powerful and efficient way to assess the performance of an XGBoost model without the need for a separate validation set. By plotting OOB estimates during training, you can keep a close eye on your model’s behavior and make informed decisions about hyperparameter tuning.