
The n_estimators parameter in XGBoost controls the number of boosting rounds or trees built by the algorithm.
It is a key hyperparameter that affects the model’s performance and training time. Increasing n_estimators can improve the model’s accuracy but also increases the risk of overfitting and the time required to train the model.
This example demonstrates how to tune the n_estimators hyperparameter using grid search with cross-validation to find the optimal value that balances model performance and training time.
import xgboost as xgb
import numpy as np
from sklearn.datasets import make_classification
from sklearn.model_selection import GridSearchCV, StratifiedKFold
from sklearn.metrics import accuracy_score

# Create a synthetic dataset
X, y = make_classification(n_samples=1000, n_classes=2, n_features=20, n_informative=10, random_state=42)

# Configure cross-validation
cv = StratifiedKFold(n_splits=5, shuffle=True, random_state=42)

# Define hyperparameter grid
param_grid = {
    'n_estimators': range(50, 550, 50)
}

# Set up XGBoost classifier
model = xgb.XGBClassifier(learning_rate=0.1, random_state=42)

# Perform grid search
grid_search = GridSearchCV(estimator=model, param_grid=param_grid, cv=cv, scoring='accuracy', n_jobs=-1, verbose=1)
grid_search.fit(X, y)

# Get results
print(f"Best n_estimators: {grid_search.best_params_['n_estimators']}")
print(f"Best CV accuracy: {grid_search.best_score_:.4f}")

# Plot n_estimators vs. accuracy
import matplotlib.pyplot as plt
results = grid_search.cv_results_

plt.figure(figsize=(10, 6))
plt.plot(param_grid['n_estimators'], results['mean_test_score'], marker='o', linestyle='-', color='b')
plt.fill_between(param_grid['n_estimators'], results['mean_test_score'] - results['std_test_score'],
                 results['mean_test_score'] + results['std_test_score'], alpha=0.1, color='b')
plt.title('Number of Estimators vs. Accuracy')
plt.xlabel('Number of Estimators')
plt.ylabel('CV Average Accuracy')
plt.grid(True)
plt.show()
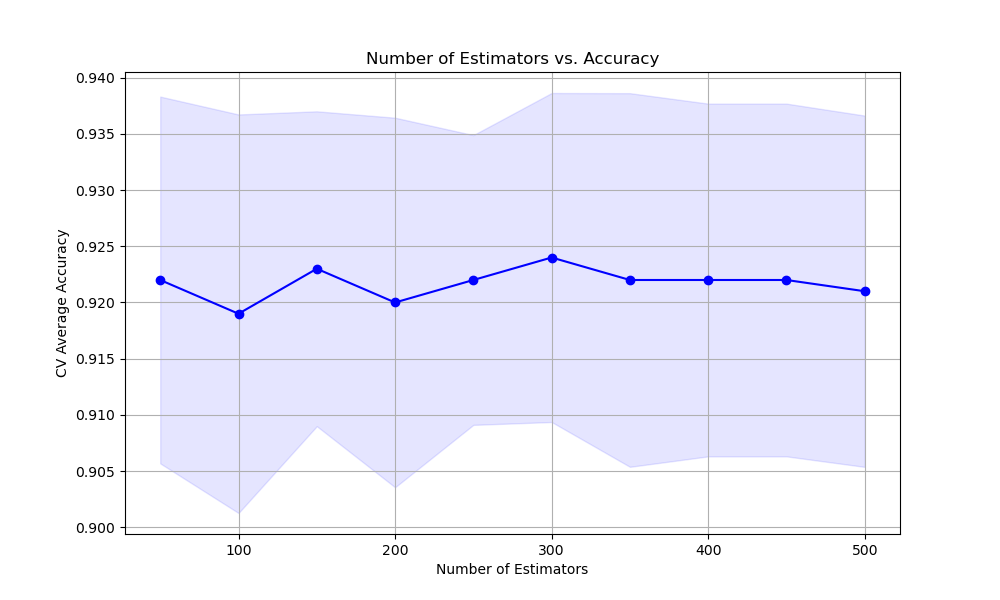
The resulting plot may look as follows:
In this example, we create a synthetic binary classification dataset using scikit-learn’s make_classification function and set up a StratifiedKFold cross-validation object.
We define a hyperparameter grid param_grid that specifies the range of n_estimators values we want to test, from 50 to 500 in increments of 50.
We create an instance of the XGBClassifier with a default learning_rate and perform grid search using GridSearchCV, specifying the model, parameter grid, cross-validation object, scoring metric (accuracy), and the number of CPU cores to use for parallel computation.
After fitting the grid search object, we access the best n_estimators value and the corresponding best cross-validation accuracy using grid_search.best_params_ and grid_search.best_score_, respectively.
Finally, we plot the relationship between the n_estimators values and the cross-validation average accuracy scores using matplotlib. We retrieve the results from grid_search.cv_results_ and plot the mean accuracy scores along with the standard deviation as error bars.
By tuning the n_estimators hyperparameter using grid search with cross-validation, we can find the optimal value that balances the model’s performance and training time. The plot can help us understand how the choice of n_estimators affects the model’s accuracy and guides us in selecting an appropriate value based on our specific requirements and constraints.