
The min_child_weight parameter in XGBoost controls the minimum sum of instance weights (hessian) needed in a child node.
It is a regularization parameter that affects the model’s complexity and generalization ability.
Larger values of min_child_weight make the model more conservative by requiring a higher sum of instance weights to create a new split, which can help prevent overfitting. Smaller values allow the model to create more complex trees, potentially capturing more granular patterns in the data.
This example demonstrates how to tune the min_child_weight hyperparameter using grid search with cross-validation to find the optimal value that balances model complexity and performance.
import xgboost as xgb
import numpy as np
from sklearn.datasets import fetch_california_housing
from sklearn.model_selection import GridSearchCV, KFold
from sklearn.metrics import mean_squared_error

# Load the Housing dataset
X, y = fetch_california_housing(return_X_y=True)

# Configure cross-validation
cv = KFold(n_splits=5, shuffle=True, random_state=42)

# Define hyperparameter grid
param_grid = {
    'min_child_weight': [1, 2, 3, 4, 5, 6, 7, 8, 9, 10]
}

# Set up XGBoost regressor
model = xgb.XGBRegressor(n_estimators=100, learning_rate=0.1, random_state=42)

# Perform grid search
grid_search = GridSearchCV(estimator=model, param_grid=param_grid, cv=cv, scoring='neg_mean_squared_error', n_jobs=-1, verbose=1)
grid_search.fit(X, y)

# Get results
print(f"Best min_child_weight: {grid_search.best_params_['min_child_weight']}")
print(f"Best CV MSE: {-grid_search.best_score_:.4f}")

# Plot min_child_weight vs. MSE
import matplotlib.pyplot as plt
results = grid_search.cv_results_

plt.figure(figsize=(10, 6))
plt.plot(param_grid['min_child_weight'], -results['mean_test_score'], marker='o', linestyle='-', color='b')
plt.fill_between(param_grid['min_child_weight'], -results['mean_test_score'] - results['std_test_score'],
                 -results['mean_test_score'] + results['std_test_score'], alpha=0.1, color='b')
plt.title('Min Child Weight vs. MSE')
plt.xlabel('Min Child Weight')
plt.ylabel('CV Average MSE')
plt.grid(True)
plt.show()
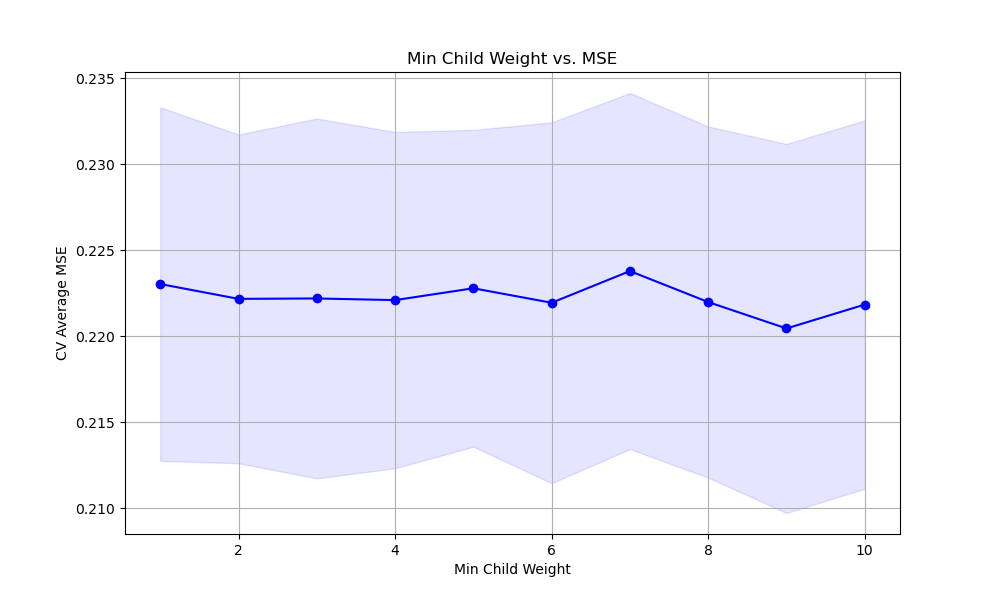
The resulting plot may look as follows:
In this example, we load the Housing dataset, a regression dataset, using scikit-learn’s fetch_california_housing function. We then set up a KFold cross-validation object to split the data into training and validation folds.
We define a hyperparameter grid param_grid that specifies the range of min_child_weight values we want to test. In this case, we consider values from 1 to 10.
We create an instance of the XGBRegressor with some basic hyperparameters set, such as n_estimators and learning_rate. We then perform the grid search using GridSearchCV, providing the model, parameter grid, cross-validation object, scoring metric (negative mean squared error), and the number of CPU cores to use for parallel computation.
After fitting the grid search object with grid_search.fit(X, y), we can access the best min_child_weight value and the corresponding best cross-validation mean squared error (MSE) using grid_search.best_params_ and grid_search.best_score_, respectively.
Finally, we plot the relationship between the min_child_weight values and the cross-validation average MSE using matplotlib. We retrieve the results from grid_search.cv_results_ and plot the mean MSE scores (negated to align with the scoring metric) along with the standard deviation as error bars. This visualization helps us understand how the choice of min_child_weight affects the model’s performance and guides us in selecting an appropriate value.
By tuning the min_child_weight hyperparameter using grid search with cross-validation, we can find the optimal value that balances the model’s complexity and performance. This helps prevent overfitting and ensures that the model generalizes well to unseen data.