
Permutation feature importance is a powerful technique for evaluating the importance of features in a machine learning model.
It works by randomly shuffling the values of each feature and measuring the decrease in the model’s performance.
This provides a more reliable estimate of feature importance compared to built-in importance measures, as it takes into account the interaction between features.
In this example, we’ll demonstrate how to use scikit-learn’s permutation_importance function to calculate and plot permutation feature importance with an XGBoost model.
We’ll use a synthetic dataset generated by scikit-learn’s make_classification function to keep the example concise and easy to understand.
from sklearn.datasets import make_classification
from sklearn.model_selection import train_test_split
from xgboost import XGBClassifier
from sklearn.inspection import permutation_importance
import matplotlib.pyplot as plt

# Generate a synthetic dataset
X, y = make_classification(n_samples=1000, n_features=10, n_informative=5, n_redundant=2, random_state=42)

# Split the data into train and test sets
X_train, X_test, y_train, y_test = train_test_split(X, y, test_size=0.2, random_state=42)

# Create an XGBClassifier
model = XGBClassifier(
    objective='binary:logistic',
    max_depth=3,
    learning_rate=0.1,
    subsample=0.8,
    colsample_bytree=0.8,
    early_stopping_rounds=10,
    n_estimators=100,
    random_state=42
)

# Train the XGBoost model
model.fit(X_train, y_train, eval_set=[(X_test, y_test)], verbose=False)

# Calculate permutation feature importance
perm_importance = permutation_importance(model, X_test, y_test, n_repeats=10, random_state=42)

# Plot permutation feature importance
sorted_idx = perm_importance.importances_mean.argsort()
plt.figure(figsize=(10, 6))
plt.barh(range(len(sorted_idx)), perm_importance.importances_mean[sorted_idx], align='center')
plt.yticks(range(len(sorted_idx)), [f'feature_{i}' for i in sorted_idx])
plt.xlabel('Permutation Feature Importance')
plt.ylabel('Feature')
plt.title('Permutation Feature Importance (XGBoost)')
plt.tight_layout()
plt.show()
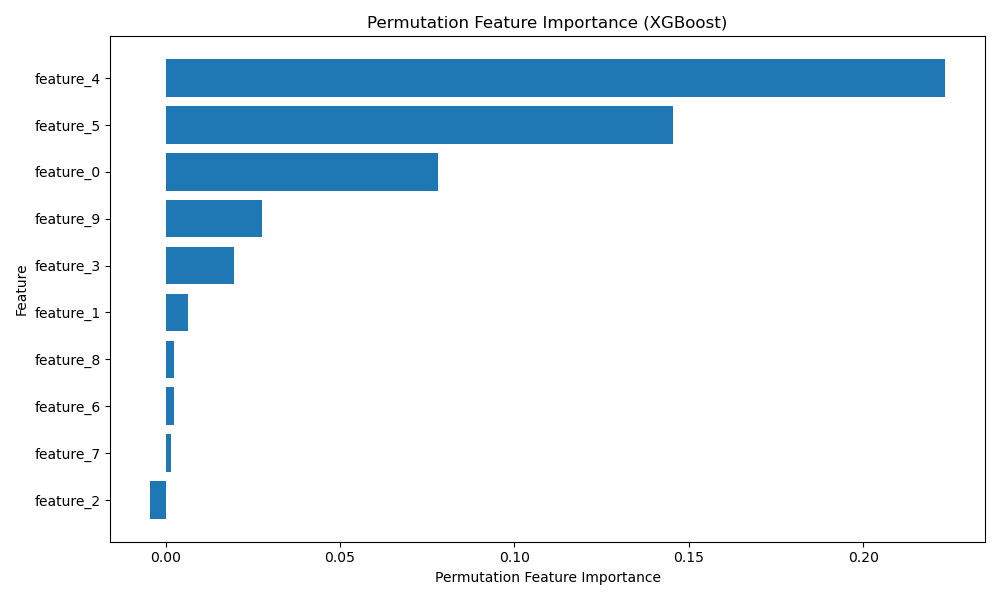
The plot may look like the following:
In this example, we first generate a synthetic dataset using make_classification() with 1000 samples, 10 features (5 informative and 2 redundant), and a random state of 42. We then split the data into train and test sets and create DMatrix objects for XGBoost.
Next, we set the XGBoost parameters and train the model using fit(). After training, we use scikit-learn’s permutation_importance() function to calculate the permutation feature importance. We set n_repeats=10 to perform 10 permutations for each feature, which helps stabilize the importance estimates.
Finally, we plot the permutation feature importance using a horizontal bar chart. We sort the features by their mean importance and customize the plot with appropriate labels and formatting.
By using permutation feature importance, you can gain a more reliable understanding of which features have the most significant impact on your XGBoost model’s predictions. This information can help guide feature selection, model interpretation, and domain-specific understanding of the problem at hand.