
XGBoost’s feature importances provide valuable insights into the relative contribution of each feature to the model’s predictions.
However, it’s important to be aware that these feature importances can be unstable, especially when dealing with complex datasets or using different random seeds and subsamples during training.
In this example, we’ll demonstrate the potential instability of XGBoost feature importances by training the same model multiple times with different random seeds and subsamples. We’ll visualize the variation in feature importances across the different runs to highlight this instability.
from sklearn.datasets import make_classification
from sklearn.model_selection import train_test_split
import xgboost as xgb
import numpy as np
import matplotlib.pyplot as plt

# Generate a synthetic dataset with 20 features, 10 of which are informative
X, y = make_classification(n_samples=1000, n_features=20, n_informative=10,
                           n_redundant=0, n_repeated=0, random_state=42)

# Split data into train and test sets
X_train, X_test, y_train, y_test = train_test_split(X, y, test_size=0.2, random_state=42)

def train_model(X, y, subsample, random_state):
    model = xgb.XGBClassifier(n_estimators=100, learning_rate=0.1, subsample=subsample, random_state=random_state)
    model.fit(X, y)
    return model.feature_importances_

# Train multiple models with different random seeds and subsamples
num_runs = 5
subsample_ratios = [0.5, 0.7, 0.9]
feature_importances = []

for subsample in subsample_ratios:
    for i in range(num_runs):
        importances = train_model(X_train, y_train, subsample, random_state=i)
        feature_importances.append(importances)

# Visualize the feature importances
plt.figure(figsize=(10, 6))
plt.boxplot(np.array(feature_importances), labels=[f"Feature {i+1}" for i in range(20)])
plt.xticks(rotation=45)
plt.title("Variation in Feature Importances Across Different Runs")
plt.xlabel("Features")
plt.ylabel("Feature Importance")
plt.show()
The plot will look like the following:
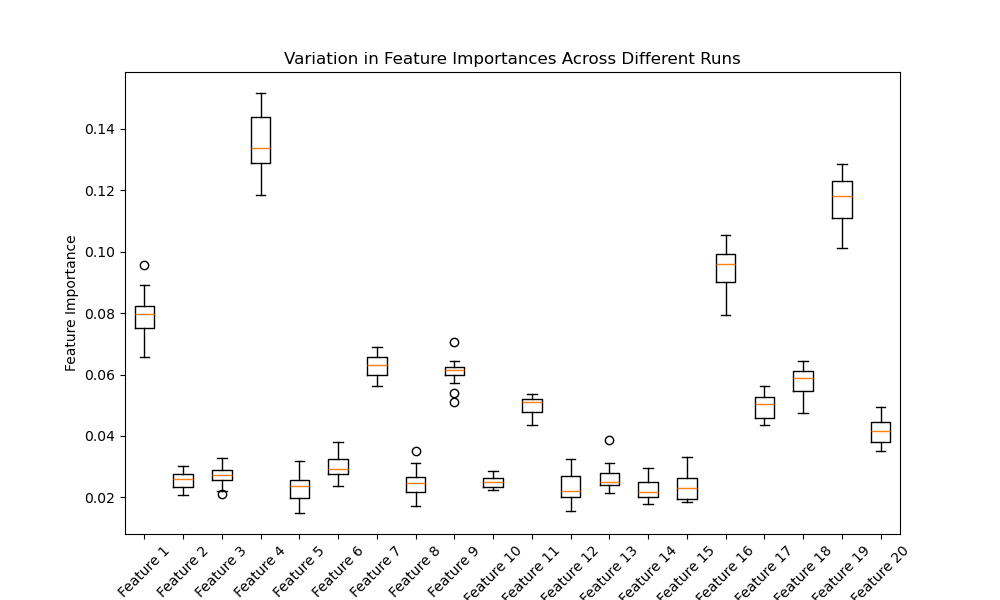
In this example, we generate a synthetic dataset with 20 features, 10 of which are informative. We then define a function train_model that trains an XGBoost classifier with a specified subsample ratio and random seed, and returns the feature importances.
We train multiple models with different random seeds and subsample ratios, storing the feature importances for each run. Finally, we visualize the variation in feature importances using a boxplot.
The resulting plot will show the distribution of feature importances for each feature across the different runs. The variation in the boxplots highlights the instability of feature importances, as the relative importance of features can change depending on the random seed and subsample used during training.
This instability in feature importances has important implications when interpreting the results of XGBoost models. It’s crucial to consider this variability and not rely solely on a single run’s feature importances when making decisions or drawing conclusions about the importance of specific features.
To mitigate this instability, it’s recommended to:
- Use a sufficiently large dataset to reduce the impact of random variations.
- Perform multiple runs with different random seeds and subsamples to assess the consistency of feature importances.
- Consider other feature importance measures, such as permutation importance or SHAP values, which may provide more stable estimates.
By being aware of the potential instability of XGBoost feature importances and taking appropriate measures to address it, data scientists and machine learning practitioners can make more reliable interpretations and decisions based on the model’s results.