
When evaluating the performance of XGBoost, it’s often useful to compare it against other popular machine learning models to gauge its relative effectiveness.
Box and whisker plots provide a clear and concise way to visualize the distribution of cross-validation scores for each model, making it easy to compare their performance and draw insights.
In this example, we’ll generate a synthetic multiclass classification dataset, train and evaluate XGBoost, Random Forest, and Support Vector Machine (SVM) models using cross-validation, and create a box plot to compare the distribution of their cross-validation scores.
from sklearn.datasets import make_classification
from sklearn.model_selection import cross_val_score
from sklearn.ensemble import RandomForestClassifier
from sklearn.svm import SVC
import xgboost as xgb
import matplotlib.pyplot as plt
import numpy as np

# Generate a synthetic multiclass classification dataset
X, y = make_classification(n_samples=1000, n_classes=5, n_features=20, n_informative=10, random_state=42)

def evaluate_model(model):
    scores = cross_val_score(model, X, y, cv=10, scoring='accuracy')
    return scores

# Initialize models with default hyperparameters
models = {
    'XGBoost': xgb.XGBClassifier(),
    'Random Forest': RandomForestClassifier(),
    'SVM': SVC()
}

# Evaluate each model and store the scores
results = {name: evaluate_model(model) for name, model in models.items()}

# Create a box and whisker plot
fig, ax = plt.subplots(figsize=(10, 6))
ax.boxplot(results.values(), labels=results.keys())
ax.set_title('Comparison of XGBoost and Other Models')
ax.set_xlabel('Model')
ax.set_ylabel('Accuracy')
plt.show()

# Print the median score for each model
for name, scores in results.items():
    print(f"{name}: Median accuracy = {np.median(scores):.4f}")
The resulting plot may look as follows:
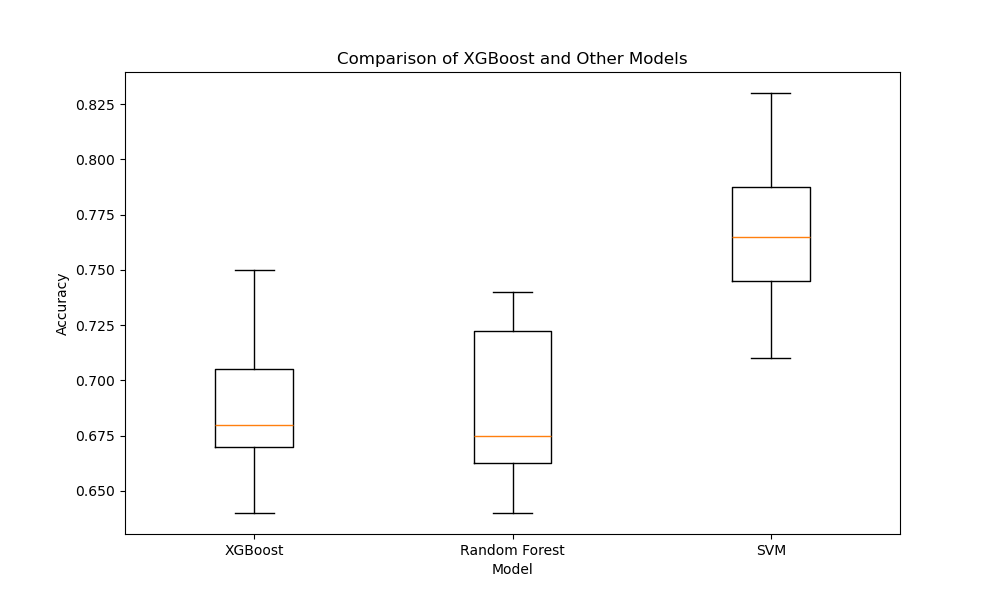
In this example, we first generate a synthetic multiclass classification dataset using scikit-learn’s make_classification function. We then define a function called evaluate_model that takes a model object, evaluates its performance using 10-fold cross-validation, and returns the scores.
Next, we initialize instances of XGBoost, Random Forest, and SVM models using their default hyperparameters. We evaluate each model using the evaluate_model function and store the cross-validation scores in a dictionary called results.
To visualize the results, we create a box and whisker plot using matplotlib. Each box in the plot represents the distribution of cross-validation scores for a specific model. By comparing the boxes, we can assess the relative performance and consistency of the models.
In this example, the box plot suggests that XGBoost and Random Forest have similar performance, with XGBoost having a slightly higher median accuracy and a smaller interquartile range, indicating more consistent results. The SVM model appears to have lower accuracy and more variability compared to the other two models.
Finally, we print the median accuracy score for each model to provide a numerical summary of the results.
Using box and whisker plots to compare XGBoost against other models allows us to visually assess their relative performance and consistency, helping us make informed decisions when choosing a model for our specific problem.