
The max_delta_step parameter in XGBoost limits the maximum change allowed in the predictions between iterations.
It helps stabilize the update steps and prevents the model from giving too much weight to individual trees, which can be useful in dealing with extreme outliers.
By tuning max_delta_step, you can find the optimal value that allows the model to make steady progress without overshooting due to large gradients. This example demonstrates how to tune the max_delta_step hyperparameter using grid search with cross-validation.
import xgboost as xgb
import numpy as np
from sklearn.datasets import make_regression
from sklearn.model_selection import GridSearchCV, KFold
from sklearn.metrics import mean_squared_error

# Create a synthetic dataset
X, y = make_regression(n_samples=1000, n_features=20, noise=0.1, random_state=42)

# Configure cross-validation
cv = KFold(n_splits=5, shuffle=True, random_state=42)

# Define hyperparameter grid
param_grid = {
    'max_delta_step': [0, 1, 5, 10, 100]
}

# Set up XGBoost regressor
model = xgb.XGBRegressor(n_estimators=100, learning_rate=0.1, random_state=42)

# Perform grid search
grid_search = GridSearchCV(estimator=model, param_grid=param_grid, cv=cv, scoring='neg_mean_squared_error', n_jobs=-1, verbose=1)
grid_search.fit(X, y)

# Get results
print(f"Best max_delta_step: {grid_search.best_params_['max_delta_step']}")
print(f"Best CV MSE: {-grid_search.best_score_:.4f}")

# Plot max_delta_step vs. MSE
import matplotlib.pyplot as plt
results = grid_search.cv_results_

plt.figure(figsize=(10, 6))
plt.semilogx(param_grid['max_delta_step'], -results['mean_test_score'], marker='o', linestyle='-', color='b')
plt.fill_between(param_grid['max_delta_step'], -results['mean_test_score'] + results['std_test_score'],
                 -results['mean_test_score'] - results['std_test_score'], alpha=0.1, color='b')
plt.title('Max Delta Step vs. MSE')
plt.xlabel('Max Delta Step')
plt.ylabel('CV Average MSE')
plt.grid(True)
plt.show()

# Train a final model with the best max_delta_step value
best_max_delta_step = grid_search.best_params_['max_delta_step']
final_model = xgb.XGBRegressor(n_estimators=100, learning_rate=0.1, max_delta_step=best_max_delta_step, random_state=42)
final_model.fit(X, y)
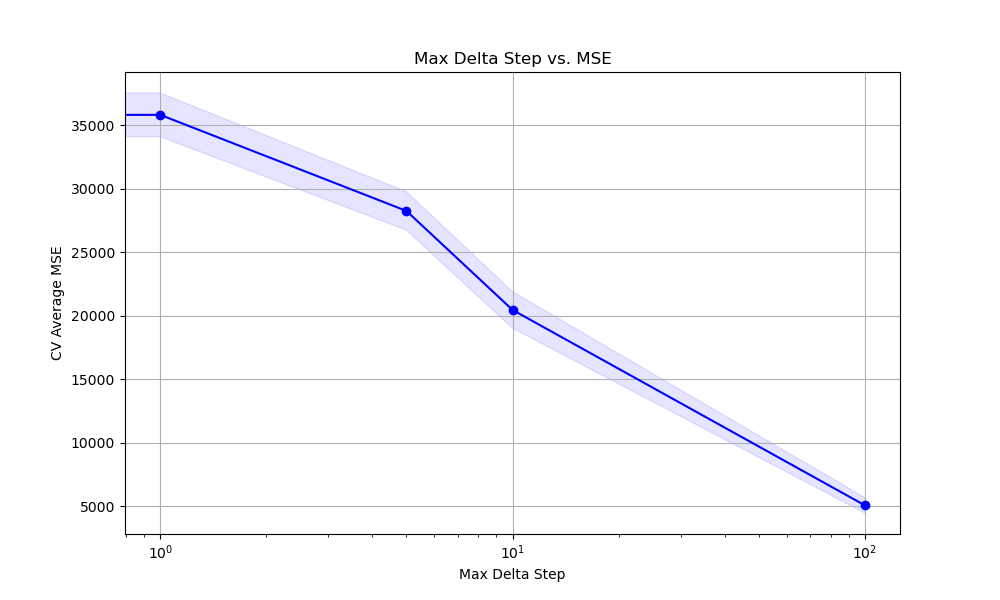
The resulting plot may look as follows:
This example uses scikit-learn’s make_regression to create a synthetic regression dataset. We then set up a KFold cross-validation object for evaluating different max_delta_step values.
The param_grid defines the values of max_delta_step to test, ranging from 0 (no constraint) to 100. An XGBRegressor is initialized with basic hyperparameters, and GridSearchCV is used to perform the grid search. The negative mean squared error (MSE) is used as the scoring metric.
After fitting the grid search object, we print the best max_delta_step value and the corresponding best cross-validation MSE. We then plot the relationship between max_delta_step and the average MSE using matplotlib, with a logarithmic scale on the x-axis to better visualize the wide range of values.
Finally, we train a model using the best max_delta_step value found during the grid search.
By tuning max_delta_step, we can find a value that allows the model to make steady progress while preventing overshooting due to large gradients. This can be particularly useful when dealing with datasets that contain extreme outliers or have high noise levels.