
The colsample_bynode parameter in XGBoost controls the fraction of features (columns) sampled at each node when building a tree.
It introduces randomness and can help prevent overfitting by reducing the correlation between trees.
This example demonstrates how to tune the colsample_bynode hyperparameter using grid search with cross-validation to find the best value for your model.
import xgboost as xgb
import numpy as np
from sklearn.datasets import make_classification
from sklearn.model_selection import GridSearchCV, StratifiedKFold
from sklearn.metrics import accuracy_score

# Create a synthetic dataset
X, y = make_classification(n_samples=1000, n_classes=2, n_features=20, n_informative=10, random_state=42)

# Configure cross-validation
cv = StratifiedKFold(n_splits=5, shuffle=True, random_state=42)

# Define hyperparameter grid
param_grid = {
    'colsample_bynode': np.arange(0.2, 0.9, 0.1)
}

# Set up XGBoost classifier
model = xgb.XGBClassifier(n_estimators=100, learning_rate=0.1, random_state=42)

# Perform grid search
grid_search = GridSearchCV(estimator=model, param_grid=param_grid, cv=cv, scoring='accuracy', n_jobs=-1, verbose=1)
grid_search.fit(X, y)

# Get results
print(f"Best colsample_bynode: {grid_search.best_params_['colsample_bynode']}")
print(f"Best CV accuracy: {grid_search.best_score_:.4f}")

# Plot colsample_bynode vs. accuracy
import matplotlib.pyplot as plt
results = grid_search.cv_results_

plt.figure(figsize=(10, 6))
plt.plot(param_grid['colsample_bynode'], results['mean_test_score'], marker='o', linestyle='-', color='b')
plt.fill_between(param_grid['colsample_bynode'], results['mean_test_score'] - results['std_test_score'],
                 results['mean_test_score'] + results['std_test_score'], alpha=0.1, color='b')
plt.title('Colsample Bynode vs. Accuracy')
plt.xlabel('Colsample Bynode')
plt.ylabel('CV Average Accuracy')
plt.grid(True)
plt.show()

# Train a final model with the best colsample_bynode value
best_colsample_bynode = grid_search.best_params_['colsample_bynode']
final_model = xgb.XGBClassifier(n_estimators=100, learning_rate=0.1, colsample_bynode=best_colsample_bynode, random_state=42)
final_model.fit(X, y)
The resulting plot may look as follows:
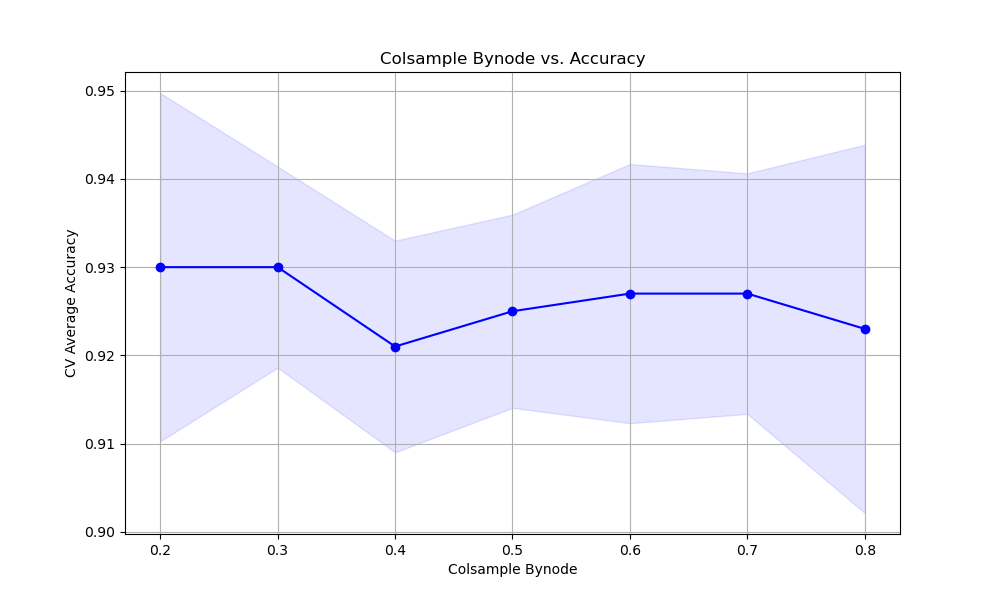
In this example, we create a synthetic binary classification dataset and set up StratifiedKFold cross-validation. We define a hyperparameter grid param_grid that specifies the range of colsample_bynode values to test, from 0.2 to 0.8 with a step of 0.1.
We create an XGBClassifier with basic hyperparameters and perform grid search using GridSearchCV. After fitting the grid search object, we access the best colsample_bynode value and the corresponding cross-validation accuracy.
We plot the relationship between colsample_bynode values and the cross-validation average accuracy scores using matplotlib. Finally, we train a final model using the best colsample_bynode value found during the grid search.
By tuning the colsample_bynode hyperparameter, we can find the optimal value that balances the model’s ability to capture important features while maintaining diversity among the trees, helping to prevent overfitting and improve generalization performance.