
The alpha parameter in XGBoost controls the L1 regularization term, which can help with feature selection and prevent overfitting by encouraging sparse solutions.
Higher values of alpha lead to more regularization and can shrink the coefficients of less important features to exactly zero. However, setting alpha too high may lead to underfitting.
An alias for the alpha parameter is reg_alpha.
This example demonstrates how to tune the alpha hyperparameter using grid search with cross-validation to find the optimal value that balances regularization and performance.
import xgboost as xgb
import numpy as np
from sklearn.datasets import make_regression
from sklearn.model_selection import GridSearchCV, KFold
from sklearn.metrics import r2_score

# Create a synthetic regression dataset
X, y = make_regression(n_samples=1000, n_features=20, n_informative=10, noise=0.1, random_state=42)

# Configure cross-validation
cv = KFold(n_splits=5, shuffle=True, random_state=42)

# Define hyperparameter grid
param_grid = {
    'alpha': [0, 0.01, 0.1, 1, 10, 100]
}

# Set up XGBoost regressor
model = xgb.XGBRegressor(n_estimators=100, learning_rate=0.1, random_state=42)

# Perform grid search
grid_search = GridSearchCV(estimator=model, param_grid=param_grid, cv=cv, scoring='r2', n_jobs=-1, verbose=1)
grid_search.fit(X, y)

# Get results
print(f"Best alpha: {grid_search.best_params_['alpha']}")
print(f"Best CV R^2 score: {grid_search.best_score_:.4f}")

# Plot alpha vs. R^2 score
import matplotlib.pyplot as plt
results = grid_search.cv_results_

plt.figure(figsize=(10, 6))
plt.semilogx(param_grid['alpha'], results['mean_test_score'], marker='o', linestyle='-', color='b')
plt.fill_between(param_grid['alpha'], results['mean_test_score'] - results['std_test_score'],
                 results['mean_test_score'] + results['std_test_score'], alpha=0.1, color='b')
plt.title('Alpha vs. R^2 Score')
plt.xlabel('Alpha (log scale)')
plt.ylabel('CV Average R^2 Score')
plt.grid(True)
plt.show()
The resulting plot may look as follows:
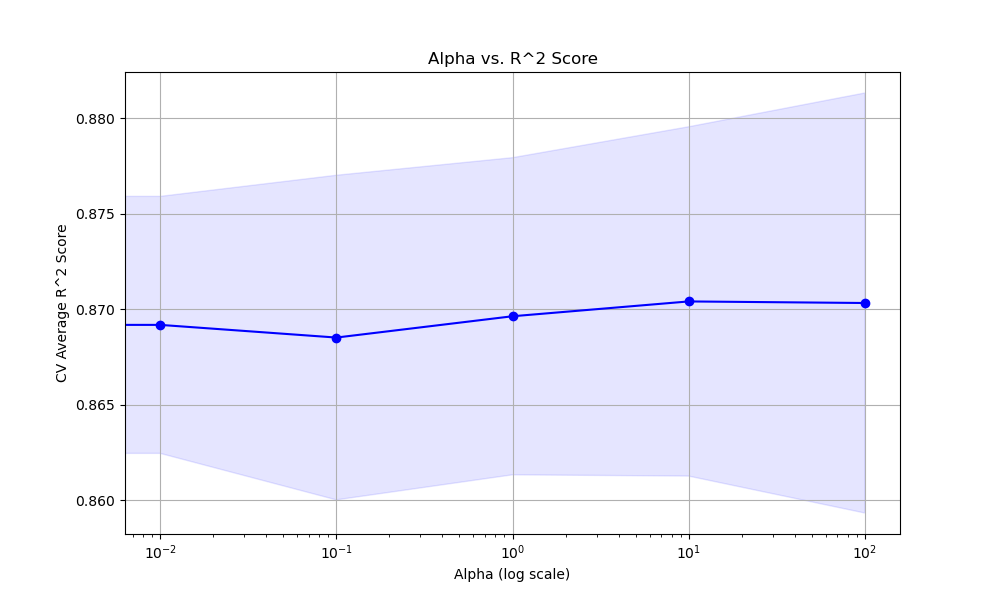
In this example, we create a synthetic regression dataset using scikit-learn’s make_regression function. We then set up a KFold cross-validation object to split the data into train and test sets.
We define a hyperparameter grid param_grid that specifies the range of alpha values we want to test, including 0 (no regularization), and increasing orders of magnitude up to 100.
We create an instance of the XGBRegressor with some basic hyperparameters set. We then perform the grid search using GridSearchCV, providing the model, parameter grid, cross-validation object, scoring metric (R^2), and the number of CPU cores to use for parallel computation.
After fitting the grid search object, we can access the best alpha value and the corresponding best cross-validation R^2 score.
Finally, we plot the relationship between the alpha values and the cross-validation average R^2 scores using matplotlib. We use a logarithmic scale for the x-axis since the alpha values span orders of magnitude. The plot includes error bars representing the standard deviation of the scores.
The optimal alpha value depends on the specific dataset and problem at hand. Setting alpha too high can lead to underfitting, while setting it too low may not provide enough regularization to prevent overfitting. It’s recommended to use grid search with cross-validation to find a good balance for each use case.